

Data analytics has become one of the most important parts of modern business. Companies use data to understand customers, track sales, control costs, measure employee performance, improve marketing, manage inventory, forecast demand, and make better decisions.
But there is one important step that many beginners ignore: data cleaning.
Many people think data analytics starts with creating charts, dashboards, and reports. They imagine colorful Power BI dashboards, sales graphs, customer trends, and business insights. But before any of that happens, the data must be checked, corrected, organized, and prepared.
This process is called data cleaning.
Data cleaning is the process of fixing problems in raw data so it becomes accurate, consistent, complete, and useful for analysis. Without clean data, even the best dashboard can show wrong results. A beautiful report with incorrect data is still a bad report.
In simple words, data cleaning is important because analytics depends on trust. If the data is wrong, the decision can also be wrong.
That is why many data analysts spend a large amount of their time preparing and cleaning data before they build reports or dashboards. Clean data helps businesses understand what is really happening. Dirty data creates confusion, mistakes, and poor decisions.
What Is Data Cleaning?
Data cleaning means finding and fixing errors, missing information, duplicate records, formatting problems, and inconsistencies in a dataset.
A dataset may look simple from the outside, but when you open it, you may find many issues. For example, customer names may be written in different ways. Dates may use different formats. Some sales values may be missing. Some records may be repeated. Some product names may have spelling mistakes. Some numbers may be stored as text. Some columns may include unnecessary information.
Data cleaning solves these problems before analysis begins.
Common data cleaning tasks include:
- Removing duplicate rows
- Fixing spelling mistakes
- Correcting date formats
- Filling or handling missing values
- Removing unnecessary columns
- Standardizing names and categories
- Correcting wrong data types
- Removing extra spaces
- Splitting or merging columns
- Checking for unusual values
- Validating totals and calculations
- Making data ready for reporting
For example, if a company has a sales file where “Toronto,” “toronto,” “TORONTO,” and “Toronto City” are all used for the same location, the report may treat them as different cities. Data cleaning helps standardize these values so the final report is accurate.
Why Data Cleaning Matters in Analytics
Data cleaning matters because analytics is only as good as the data behind it.
A dashboard does not create truth by itself. It only shows what the data says. If the data has errors, the dashboard will also have errors.
Imagine a company wants to know which product sold the most last month. If the sales data has duplicate invoices, missing product names, wrong prices, or incorrect dates, the final report may show the wrong top-selling product. Management may then order more inventory for the wrong item.
This is why data cleaning is not a small technical step. It directly affects business decisions.
Clean data helps companies:
- Make better decisions
- Trust reports and dashboards
- Understand real performance
- Reduce reporting errors
- Improve customer analysis
- Build accurate forecasts
- Save time during reporting
- Improve team confidence
- Avoid wrong business conclusions
Dirty data does the opposite. It creates doubt, delays, and mistakes.
What Is Dirty Data?
Dirty data means data that contains mistakes, missing details, duplicate information, incorrect formatting, or values that do not make sense.
Dirty data can come from many sources. It may come from manual entry, old systems, customer forms, spreadsheets, website forms, sales tools, finance software, HR systems, inventory systems, or third-party files.
Examples of dirty data include:
- Customer names spelled differently
- Duplicate customer records
- Missing phone numbers or emails
- Sales amounts entered incorrectly
- Wrong date formats
- Product categories written inconsistently
- Empty cells in important columns
- Extra spaces before or after text
- Numbers stored as text
- Invalid postal codes
- Incomplete addresses
- Outdated records
- Mixed currencies
- Wrong tax values
- Negative values where they should not exist
Dirty data is common because businesses collect information from many places. When data comes from different systems and people, errors are almost guaranteed.
A Simple Example of Dirty Data
Let’s say a company has the following sales records:
| Customer Name | City | Product | Amount |
| John Smith | Toronto | Laptop | 1200 |
| John Smith | toronto | Laptop | 1200 |
| J. Smith | Toronto | Laptop | 1200 |
| Sarah Khan | Mississauga | Monitor | 300 |
| Sarah Khan | Missisauga | Monitor | 300 |
| Ahmed Ali | Brampton | Keyboard | empty |
At first, this table looks normal. But there are several problems:
- John Smith may be repeated three times.
- Toronto is written in two different ways.
- Mississauga is spelled incorrectly once.
- Ahmed Ali has a missing amount.
- The same sale may have been counted more than once.
If this data is used without cleaning, the company may overestimate sales, count customers incorrectly, or create inaccurate city-based reports.
Data cleaning fixes these issues before analysis.
How Dirty Data Affects Business Decisions
Dirty data can create serious business problems. It may not always look dangerous at first, but the impact can be large.
1. Wrong Reports
Reports are used by managers, finance teams, sales teams, marketing teams, and business owners. If the data is wrong, the report will be wrong.
For example, a sales dashboard may show that revenue increased by 20%. But if duplicate invoices were included, the increase may not be real.
2. Poor Customer Understanding
Companies use data to understand customer behavior. Dirty customer data can make it difficult to know who the customers are, where they live, what they buy, and how often they return.
Duplicate customer records can make one customer look like three different people. Missing contact details can affect marketing campaigns. Incorrect locations can affect regional planning.
3. Bad Financial Decisions
Finance teams depend on accurate data. If expense records, sales data, invoices, or payment information contain errors, the company may make poor financial decisions.
For example, wrong cost data may affect profit calculations. Missing payment records may affect cash flow reports.
4. Inventory Problems
Retail, manufacturing, and warehouse teams need accurate inventory data. Dirty data can cause overstocking, stockouts, delayed orders, and poor demand planning.
If product names or item codes are inconsistent, the system may not show the correct stock level.
5. Poor Marketing Results
Marketing teams use data for email campaigns, customer segmentation, lead tracking, and performance analysis. Dirty data can lead to duplicate emails, wrong targeting, and inaccurate campaign reports.
6. Loss of Trust
When people find mistakes in reports, they stop trusting the data. Once trust is lost, teams may go back to manual checking, extra spreadsheets, and repeated verification.
This slows down the entire business.
Why Data Cleaning Comes Before Data Visualization
Data visualization is the process of showing data through charts, graphs, dashboards, and reports. Tools like Power BI, Tableau, and Excel make it easier to visualize data.
But visualization should not be the first step.
Before creating a chart, the analyst must ask:
- Is the data complete?
- Are there duplicates?
- Are categories consistent?
- Are dates correct?
- Are numbers in the correct format?
- Are there missing values?
- Are there unusual values?
- Is the data relevant to the question?
If these questions are not answered, the final dashboard may look professional but still be incorrect.
For example, a Power BI dashboard may show sales by region. But if “Ontario,” “ON,” and “Ont.” are treated as different regions, the report will be confusing.
This is why Power BI users often use Power Query to clean and transform data before building dashboards. Microsoft’s Power Query documentation explains how Power Query helps users connect, filter, combine, and transform data from different sources.
The Relationship Between Data Cleaning and Data Quality
Data cleaning is closely connected to data quality.
Data quality means how suitable the data is for use. High-quality data is accurate, complete, consistent, valid, unique, timely, and useful.
Good data quality means:
- The data is correct.
- Important fields are not missing.
- Values follow the same format.
- Records are not duplicated.
- Data is updated when needed.
- The data matches business rules.
- The data can be trusted for decisions.
IBM explains that data cleaning helps ensure data is accurate, complete, consistent, and usable for analysis or decision-making. That is the main goal of cleaning data: to make it reliable enough for meaningful analysis.
Common Data Cleaning Problems Beginners Should Know
Beginners in data analytics should understand the most common data cleaning problems. These problems appear in almost every real-world dataset.
1. Missing Values
Missing values happen when a cell is empty or incomplete. For example, a customer record may have no email address, a sales file may have no region, or an invoice may have no payment date.
Missing values must be handled carefully. Sometimes they can be filled. Sometimes they should be removed. Sometimes they should be marked as unknown.
The right approach depends on the situation.
2. Duplicate Records
Duplicates happen when the same record appears more than once. This can happen when data is imported from multiple systems or entered manually.
Duplicate records can make totals incorrect. For example, if one sale appears twice, revenue may be overstated.
3. Inconsistent Formatting
Formatting problems are very common. Dates may appear as “01/05/2026,” “May 1, 2026,” and “2026-05-01.” Names may use uppercase, lowercase, or mixed formats.
Inconsistent formatting makes analysis harder.
4. Wrong Data Types
A number may be stored as text. A date may be stored as a general text field. A percentage may be stored as a decimal without proper formatting.
Wrong data types can break calculations and charts.
5. Spelling Mistakes
Spelling mistakes can create separate categories. For example, “Mississauga” and “Missisauga” may appear as two different cities.
6. Extra Spaces
Extra spaces are hard to notice but can cause problems. “Toronto” and “ Toronto” may look similar, but a system may treat them as different values.
7. Irrelevant Data
Not all data is useful. Some columns may not help answer the business question. Removing irrelevant data makes analysis cleaner and easier.
8. Outliers
Outliers are values that look unusual compared to the rest of the data. For example, if most orders are between $50 and $500, but one order shows $500,000, the analyst should check whether it is correct.
Outliers are not always errors. Sometimes they are important. But they should always be investigated.
The Data Cleaning Process Step by Step
Data cleaning can be different for every project, but the general process usually follows these steps.
Step 1: Understand the Data
Before cleaning, you need to understand what the data represents. You should know where it came from, what each column means, and what business question you are trying to answer.
For example, if you are analyzing sales data, you should understand customer fields, product fields, date fields, order values, discounts, taxes, and payment status.
Step 2: Check the Structure
Look at the columns, rows, headings, and data types. Make sure the dataset is organized properly.
Ask yourself:
- Are column names clear?
- Are there unnecessary columns?
- Are important columns missing?
- Are numbers, dates, and text stored correctly?
- Are there blank rows?
Step 3: Remove Duplicates
Check whether the same record appears more than once. Removing duplicates helps prevent overcounting.
But be careful. Sometimes two records look similar but are actually different. Always understand the business context before deleting data.
Step 4: Handle Missing Data
Find empty cells and decide how to handle them.
You may:
- Fill missing values with a suitable value
- Replace missing values with “Unknown”
- Remove incomplete records
- Use calculations or rules to estimate missing values
- Leave them blank if appropriate
There is no single answer for every case.
Step 5: Standardize Formats
Make sure values follow a consistent format. Dates should use one format. Country names, city names, department names, and product categories should be standardized.
For example, use either “Canada” or “CA,” but not both in the same report.
Step 6: Correct Errors
Fix spelling mistakes, incorrect values, and data entry errors. This may require checking source documents, business rules, or system records.
Step 7: Validate the Data
After cleaning, check whether the data makes sense.
Ask:
- Do totals match expected numbers?
- Are there unusual values?
- Are all required fields complete?
- Do dates fall within the correct period?
- Are categories properly grouped?
- Are calculations correct?
Validation helps ensure that cleaned data is ready for analysis.
Step 8: Document the Cleaning Steps
Documentation is important. You should record what changes were made and why.
This helps other people understand the process. It also makes the analysis easier to repeat in the future.
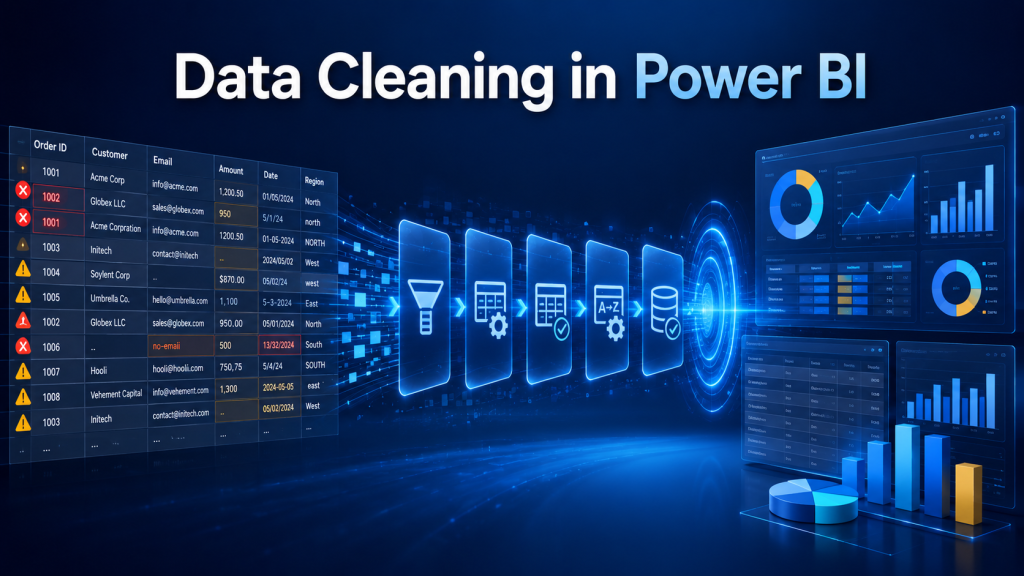
Data Cleaning in Power BI
Power BI is widely used for business intelligence and reporting. But before building charts and dashboards, users often need to clean data using Power Query.
Power Query allows users to:
- Remove columns
- Rename columns
- Change data types
- Remove duplicates
- Filter rows
- Replace values
- Split columns
- Merge columns
- Combine tables
- Group data
- Pivot and unpivot data
- Create calculated columns
- Clean text fields
This is why data cleaning is a key skill for anyone learning Power BI.
A person who only knows how to make charts may struggle with real business data. But someone who understands data cleaning can turn messy raw data into useful business insights.
Students and professionals interested in reporting, dashboards, and analytics can explore the Data Analytics and Reporting with Power BI Course at Toronto Innovation College to understand how data preparation, reporting, and visualization work together.
Why Data Cleaning Saves Time Later
Some beginners think data cleaning takes too much time. But skipping data cleaning usually creates more work later.
If data is not cleaned at the beginning, problems may appear during reporting. Charts may not work. Totals may be wrong. Filters may behave strangely. Categories may split incorrectly. Managers may question the results.
Then the analyst must go back, find the problem, fix the data, rebuild the report, and explain why the earlier version was incorrect.
Cleaning data early saves time because it prevents errors from spreading.
A clean dataset also makes future reports easier. Once the structure is correct, the data can be reused, refreshed, and updated more efficiently.
Data Cleaning and Business Intelligence
Business intelligence means using data to understand business performance and support decision-making.
Data cleaning is important for business intelligence because business leaders depend on accurate reports.
A business intelligence report may show:
- Monthly sales
- Revenue by product
- Profit by region
- Customer growth
- Employee performance
- Inventory movement
- Marketing results
- Financial trends
- Budget performance
If the data behind these reports is not clean, the insights may be misleading.
For example, if one customer appears under three different names, the company may not correctly identify its top customers. If a product category is inconsistent, product performance may be wrong. If dates are incorrect, monthly trends may be unreliable.
Clean data helps business intelligence become useful and trustworthy.
Data Cleaning and Artificial Intelligence
Artificial intelligence also depends on clean data. AI systems learn from data. If the data is poor, the AI output may also be poor.
For example, if a company uses AI to predict customer behavior, but the customer data has duplicates, missing values, and wrong categories, the prediction may be unreliable.
This is why data preparation is important not only for dashboards but also for machine learning and AI projects.
Clean data improves:
- Prediction accuracy
- Model reliability
- Customer segmentation
- Forecasting
- Automation results
- AI decision support
As AI becomes more common in business, data cleaning becomes even more important.
Real-Life Example: Sales Dashboard
Imagine a company wants to create a sales dashboard in Power BI. The goal is to show monthly sales, top products, customer locations, and salesperson performance.
The raw data includes sales from different branches. When the analyst reviews the data, they find these problems:
- Some dates are missing.
- Some product names are spelled differently.
- Some customers are duplicated.
- Some sales amounts are blank.
- Some branches use different location names.
- Some salespeople are listed with nicknames.
- Some returned orders are included as positive sales.
If the analyst builds a dashboard without cleaning the data, the report will be inaccurate.
After cleaning, the analyst can:
- Standardize product names
- Fix date formats
- Remove duplicate transactions
- Correct customer records
- Separate returns from sales
- Standardize branch names
- Validate sales totals
Now the dashboard can show more reliable results.
This example shows why data cleaning is not just a technical task. It directly affects the quality of business insights.
Important Data Cleaning Skills for Beginners
Beginners who want to grow in data analytics should build strong data cleaning skills.
Important skills include:
- Understanding spreadsheets
- Using filters and sorting
- Removing duplicates
- Working with formulas
- Understanding data types
- Cleaning text values
- Handling missing data
- Using Power Query
- Understanding business rules
- Checking data accuracy
- Creating clean tables
- Validating results
- Explaining cleaning decisions
These skills are useful for data analysts, business analysts, reporting analysts, finance analysts, marketing analysts, operations analysts, and business intelligence roles.
Mistakes Beginners Make During Data Cleaning
Data cleaning is powerful, but beginners should avoid common mistakes.
1. Cleaning Without Understanding the Business
You should not change data blindly. Always understand what the data means before editing it.
2. Deleting Too Much Data
Removing data may be necessary, but deleting too much can affect analysis. Always check before removing records.
3. Ignoring Missing Values
Missing values can affect results. They should be reviewed and handled properly.
4. Not Keeping a Backup
Always keep a copy of the original data. This helps if you need to check or reverse changes.
5. Not Documenting Changes
If you do not document cleaning steps, others may not understand how the final data was prepared.
6. Trusting Data Too Quickly
Even if data looks clean, it may still have hidden issues. Always validate important fields and totals.
How Clean Data Helps Different Teams
Clean data benefits many departments.
Sales Teams
Sales teams can understand customer behavior, product performance, and regional sales trends.
Finance Teams
Finance teams can prepare accurate reports, budgets, forecasts, and cash flow analysis.
Marketing Teams
Marketing teams can target the right audience, measure campaign results, and reduce duplicate contacts.
HR Teams
HR teams can analyze employee attendance, turnover, training, and performance data.
Operations Teams
Operations teams can track inventory, delivery timelines, production output, and efficiency.
Management
Managers can make decisions based on reliable information.
Why Data Cleaning Comes Before Data Visualization
Data visualization is the process of showing data through charts, graphs, dashboards, and reports. Tools like Power BI, Tableau, and Excel make it easier to present data visually and understand business trends.
But visualization should not be the first step.
Before creating a chart, the analyst must ask:
Is the data complete?
Are there duplicates?
Are categories consistent?
Are dates correct?
Are numbers in the correct format?
Are there missing values?
Are there unusual values?
Is the data relevant to the question?
If these questions are not answered, the final dashboard may look professional but still show incorrect results.
For example, a Power BI dashboard may show sales by region. But if “Ontario,” “ON,” and “Ont.” are treated as different regions, the report can become confusing and unreliable.
This is why Power BI users often clean and transform data before building dashboards. Power Query helps users connect to data sources, prepare data, transform fields, combine information, and organize data into a usable format for reporting.
The Relationship Between Data Cleaning and Data Quality
Data cleaning is closely connected to data quality.
Data quality means how suitable the data is for use. High-quality data is accurate, complete, consistent, valid, unique, timely, and useful.
Good data quality means:
The data is correct.
Important fields are not missing.
Values follow the same format.
Records are not duplicated.
Data is updated when needed.
The data matches business rules.
The data can be trusted for decisions.
IBM explains that data cleaning supports better data quality by helping make data accurate, complete, consistent, and usable for analysis and decision-making. In simple terms, the purpose of data cleaning is to make information reliable enough for meaningful business insights.
Data Cleaning in Power BI
Power BI is widely used for business intelligence and reporting. But before building charts and dashboards, users often need to clean and prepare their data using Power Query.
Power Query allows users to:
Remove columns
Rename columns
Change data types
Remove duplicates
Filter rows
Replace values
Split columns
Merge columns
Combine tables
Group data
Pivot and unpivot data
Create calculated columns
Clean text fields
This is why data cleaning is a key skill for anyone learning Power BI.
A person who only knows how to make charts may struggle with real business data. But someone who understands data cleaning can turn messy raw data into useful business insights.
Toronto Innovation College offers practical Data Analytics and Reporting with Power BI training designed to help learners understand data preparation, Power Query, dashboard development, reporting techniques, and business intelligence concepts.
Conclusion
Data cleaning is the most important step in analytics because every report, dashboard, chart, and business decision depends on the quality of the data.
Dirty data can lead to wrong reports, poor decisions, duplicate records, financial errors, inventory problems, and loss of trust. Clean data helps businesses understand reality more clearly.
Before creating dashboards or visualizations, analysts must check for missing values, duplicates, formatting issues, wrong data types, spelling mistakes, irrelevant data, and unusual values. Tools like Power Query in Power BI make this process easier, but the analyst still needs strong judgment and attention to detail.
As businesses continue to use data analytics, business intelligence, and artificial intelligence, data cleaning will become even more important. Clean data is the foundation of useful analytics.
In simple words, if the data is not clean, the insights cannot be trusted.
For anyone starting a career in analytics, learning data cleaning is one of the smartest first steps. It builds confidence, improves reporting accuracy, and prepares you for real-world business data.
FAQs
1. What is data cleaning in analytics?
Data cleaning is the process of fixing errors, missing values, duplicates, formatting issues, and inconsistencies in data before analysis.
2. Why is data cleaning important?
Data cleaning is important because reports and dashboards depend on accurate data. If the data is wrong, the analysis will also be wrong.
3. What are examples of dirty data?
Examples include duplicate records, missing values, spelling mistakes, wrong date formats, numbers stored as text, and inconsistent category names.
4. Is data cleaning required in Power BI?
Yes. Power BI users often clean and transform data using Power Query before creating dashboards and reports.
5. How does dirty data affect business decisions?
Dirty data can lead to wrong reports, poor financial decisions, bad marketing targeting, inventory issues, and loss of trust in analytics.
6. What is the difference between data cleaning and data analysis?
Data cleaning prepares the data by fixing problems. Data analysis uses the cleaned data to find trends, patterns, and insights.
7. Can AI work with dirty data?
AI can process dirty data, but the results may be unreliable. Clean data improves AI accuracy and decision-making.
8. What skills are needed for data cleaning?
Important skills include Excel, Power Query, data types, filtering, removing duplicates, handling missing values, standardizing formats, and validating results.
9. Is data cleaning hard for beginners?
It can be challenging at first, but beginners can learn it step by step through spreadsheets, Power BI, and real-world practice.
10. Why do data analysts spend so much time cleaning data?
Because real-world data often contains errors. Analysts clean data to make sure reports, dashboards, and insights are accurate and trustworthy.